Sharing design research findings is a bit like one of 'those' jokes

You had to be there. (Video)

Like one of ‘those’ jokes, design research has the most impact to those who were there in the moment.

In this video – from a presentation hosted at eBay Design in San Francisco – I explain how I try to help client teams discover their own punchline from user research, by designing experiences for them rather than delivering findings to them.

Continue reading

Steve Portigal answering classic design research questions.

Patterns in design research. (Video)

As the business and design worlds adopt design research, I see patterns.

One of those patterns lies in the questions I’m asked by new clients.
Sometimes they are new to qualitative research, and increasingly they’ve done some lightweight interviewing as part of an innovation or design thinking exercise and want to know more.

My confidence in answering these questions builds over time, so to hear a design research veteran tackle the same questions … that’s gold.

Continue reading

Blog pic

Nine nourishing nuggets

Over the NZ summer, I deliberately made time to nourish my professional self.

Inspiration came from 5 podcasts, 2 books and a 2 short but atmospheric films.

I’d squirrelled dozens of potentially inspiring articles, podcasts and videos over the year, waiting to filter them for quality, then absorb them… undistracted, to the sound of cicadas.

A few were memorable, including:

  • A peculiar ‘outsider view’ on UX research,
  • Podcasts on social research and why people do what they do,
  • Interviews with designers I admire about their work, and approaches to product development,
  • A couple of rather chilling ethno-books by people who gave their all to understand another people.
  • A couple of gorgeous videos spotlighting the beauty of heavy manufacturing – sheffield style,
  • A short surf adventure in Iceland, captured in inimitable ironic Kiwi narrative.
  • … and some envy-inducing lifestyle portraits of people who’ve made creativity into a lifestyle,

Here’s a snapshot of each, and why I found it worthy brain fodder for my work in design / research:

5 Podcasts

UX seduction at Etsy
Journalism meets UX research. This account of the interviewee’s perspective in a ‘usability test’ is a surreal experience given I’ve conducted hundreds of these sessions in my time.
The host of the podcast feels more like they’ve been part of an experiment than ‘helping improve a product’, and (tries to) delve into the ethics behind the way e-commerce sites steer our minds.
Hearing this makes me want to interview the interviewees from user research sessions to find out what level of cynicism and undercurrents of curiosity really does ship as standard with participants in these studies.

‘The big interview’ with Thomas Heatherwick & Monocle
I used to ride past his office in London when the models for his ‘rolling bridge’ were in the window, but the bridge hadn’t become a reality.

Now it’s in his back catalogue, and Terence Conran has declared Thomas Heatherwick ‘the Leonardo Da Vinci of our time. … a handle he’s clearly not comfortable with.
Though he gets a bit earnest at times, I was taken by his lack of ego. A humble designer untethered to a medium with a solid worship of idea over process.

He reminds me at times of the profile of Marc Newson, who in ‘Urban Spaceman’ share the same comments about being material and subject matter agnostic as a designer.

Thinking allowed
Fascinating sociology podcasts from the BBC. Laurie, the curious interviewer frames up myriad topics beautifully, then chats with people who’ve studied people in that context.

It’s good stuff. Highly conversational, so you don’t need to wade through the academic fluff as you find out about things like what motivates middle class kids who want for nothing but become drug dealers, or changing attitudes to how we navigate our careers, to children’s changing attitude to money.

Perfect podcasts for a walk around the block. If your block takes about 20 mins.

Paul Adams on Product
Never short on an opinion, and always worth listening to, Paul Adams is quite the influential voice on what it takes to make a great digital product.

We worked together at Flow, a company since absorbed into Europe’s largest UX consulting agency. Now – after serving a Silicon Valley sentence – He’s putting his learnings into play at Intercom, in Dublin, where he’s using what he refers to as the ’6-6-6’ roadmap for product development.

For those who (like me) suffer fatigue from the newfangled recipes for success, it’s summed up here as a 2min read, but the podcast is worth a listen to any product strategy or team leader.

Guerilla interviews in South Auckland 
This is guerrilla street interviewing at it’s best, by a master who really connects.
John Campbell’s authentic and probing dialogue makes you feel like you’re there with him. This is all laid down with brilliantly executed post production to stitch the story together.
There’s only a couple of these articles, but they are worth a listen, as he interviews people at the low end of the socio-economic spectrum, and very quickly gets down to brass tacks about their day to day struggle to live in our biggest city.

2 books:

On the run, with Alice Goffman

Reading this book is a little like a personal account of living in the series ‘the wire’…
…but instead of an HBO production crew, it’s seen through the lens of an ethnographer.

New York book review calls it an ‘ethnographic classic’, but it’s also been controversial.

Alice, a middle class academic moved in and spent six years living in a troubled Philadelphia neighborhood and saw first-hand how teenagers of African-American and Latino backgrounds are “funneled down the path to prison”.

This is journalism meets ethnography, and you’d expect rigour from the daughter of the “most important sociologist of the last 50 years” … So reading about her in-the field practices of note taking, logging of events etc. .. I shudder to imagine how much data she was wading through while examining these lives at such close range.

Academic sociologists felt she was too close to her subjects and took liberties in the way she wrote, while Journalists, (likely stunned at the depth and richness of her account) simply picked holes in the details, dismissing it’s value as a true account.

If you haven’t got the time to read the book… here’s a TED

Patched. when ethnography goes underground.
This book is the result of New Zealand’s largest ever study of gangs in NZ, with much of the story captured via a long and dangerous ethnography.

“I hung out with the gangs” says Jarrod Gilbert, and the stories he’s dredged up paint a rich and sometimes raw picture of this part of our social history.
He spent six years researching gangs, which meant drinking with them, listening to them, tuning motorbikes together and figuring out what to say and what not to say. He admits he was “on the wrong end of a couple of beatings” and his liver took a beating as well.

This all led to a prize-winning academic book, Patched, but like Alice and her book on life as a fugitive in Philadelphia, This author too has had their work controversially discredited by authority (in this case the Police) because he was too close to the subjects.

 2 Short films

For some eye candy I soaked up these two gems:

Barry Can’t arf Weld.
A totally gorgeous piece of atmosphilm – this short but powerful video essay rips into you with sound and motion.
Follow the journey of a few kilos of molten metal all the way to becoming a railway bogey. It’s so raw, noisy and dirty it makes you want to reach for the Swarfega.

…But then you kinda wish you could don a pair of steel caps and join in the fun in the dark and forbidding bowels of this Sheffield foundry.
Delicious.

‘Brass monkey’ surfing in Iceland.
A somehow timeless surfing ‘roadie’ flick. Filmed in in Iceland of all places by three Kiwi wax-heads mad enough to take this on.
Equal parts warming and super frosty, with the kind of dry, tongue-in-cheek-narration to bring you along on the romance of the trip.

Oh, did I say 9?

… come on, just one more …

As a some-time architect of my own lifestyle. I’m a hoover for inspiration … pondering other people’s existence. … and here at Freunden von Freunden (friends of friends) is where I found a stack:

These are styled portraits showcasing the lives of a privileged few creative people who have made a life from what they love and seek and create. Including a few Kiwis

Ok, and one more makes 11

I’ve also been piecing together a wee story about my own product development – of Mr. Tappy, a mobile UX research tool. I’m as proud as I am surprised with how it’s evolved.

Great to have found the time to indulge, and now share some brain fodder and use some of those muscles which -during the year- only get a 2 minute workout on short articles.

Thanks for reading and here’s to 2016!

siggy


UX-gender-spectrum-sketch

The UX gender spectrum…

Does UX research attract more women than men?

I sometimes refer to the various roles within UX as running along a spectrum from research at one end to design at the other. It might be more convenient than realistic, but I’ve found it’s a pretty solid metaphor when asking colleagues where along the spectrum their deep skill-set lies or where they have the most fun.

…but I’d never considered each end of the spectrum might attract a different gender.

In fact, after moving from earlier careers of men and machines, I’ve enjoyed working in what’s seemed like a gender-balanced environment of UX / user centred design. I’ve even spoken out before on this when I’ve felt things weren’t quite representative.

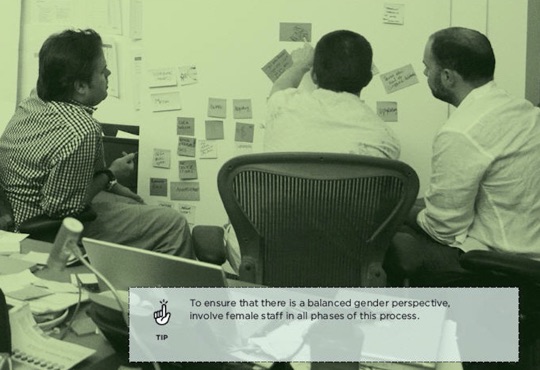
Top Tip from IDEO's (hu)man Centred Design Toolkit.

Top Tip from IDEO’s (Hu)man Centred Design Toolkit. (2009)

So last month when speaking about visualising design research to audiences in New York and San Francisco I was surprised to notice men were significantly out-numbered by women.

In one talk there was only one man in an audience of dozens,
Another talk, only two men.

This made me wonder… was this representative of the profession?

This job ad for a design researcher at an agency in Minneapolis seems to suggest so…

designresearcher worrell2

In this ‘People understanding company’ in Europe, women outnumber men two to one.

https://www.happythinkingpeople.com/the-team/

… and a LinkedIn search seems to think so too:

A search for ‘design researcher’ in the SF Bay Area returns 26 women and 4 men in the first 30 results.

So, if there is a pattern like the rudimentary graph above…

  • Why is this?
  • What is it about the profession, that attracts more women than men?
  • Is it that women are somehow suited to design research? Why is that?
  • Has it always been this way, or is it changing?
  • What does it say about the other end of the spectrum?

And – on a professionally embarrassing note – how did I miss such a fundamental demographic trend in my own industry, given that spotting patterns in people is a core part of my work?

Perhaps some of you lovely men AND women readers can answer some of these curly questions?


Nick prototyping a customer journey map

Visualising Design Research

How to put down your bullet points and pick up a pencil…

I’ve almost given up on delivering written reports as a UX research output, favouring video and large scale visuals instead. (I explain why here)

How to:

In this article I’ll walk through my process and the tools I use, in the hope you can do something similar for your clients.


This is also a way to share some of the content of a few talks I gave in NY and SF in 2015, about visualising design research.

My talk ran through how I’ve blended communication styles from former careers in art and architecture to communicate the types of insights we find in UX research projects, where I’ve found traditional reports just don’t cut it.

One thing I wanted to be sure my audiences took away was a feeling of “I could totally give that a go on my next project”.

So if after reading this article you’re not thinking like that, I’ve missed the mark. Doh.


Here’s one I prepared earlier:

Design research illustration by Nick Bowmast

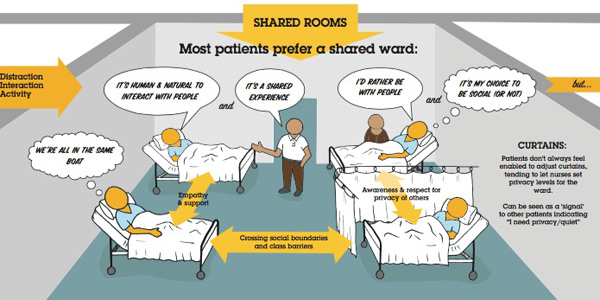
For ‘Ward life’, a project for a healthcare client – I was asked for only visual deliverables, as the team found the video/poster combo so compelling on our previous project it left the report in the dust. 

Knowing there would be a visual at the end, I photographed the process so I could share it.

The goal was to understand the social and emotional experience of patients in a shared hospital ward situation. I partnered with a chaperone (who’s also a natural interviewer) and we hit the wards – spoke to nurses, patients, their families etc., emerging later with insights – as you do.

This part of a research project is where you need to start considering how best to communicate what you’ve found…


Here are the steps I took to convert a set of findings into this visual:

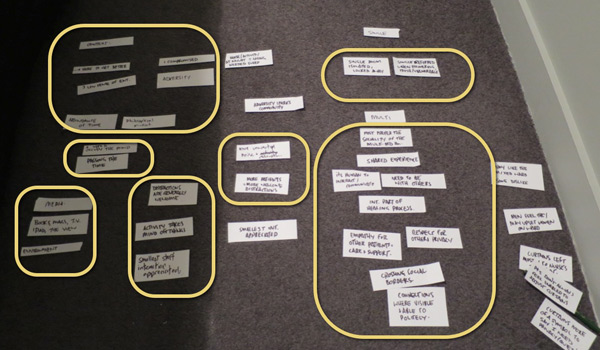
FIRST: Lay out your key insights.

These can be single words, or statements.
Arrange these in a way which best frames the messages you want to communicate.
Insights-on-floor-600

Group around themes and sub-themes, relationships, this one feeds into that one etc.
While doing this I’m thinking of a narrative. A starting point and the flow, or the way I want the viewer to take in the content.
In this case I’ve grouped the insights around:

  • The patient’s context
  • Their mindset and moods
  • Environmental factors which contribute to their experience
  • The importance of distraction
  • The psycho-social aspects of being in the shared ward, and in a single room.

… and as I’m doing it I’m realising, how these relate to each other.

Thinking in two dimensions.

This is a bit like ‘storyboarding’ – you’re essentially weaving a story, frame by frame.
I’ve found moving the parts around directly on paper is a great way to build a story, and helps me join the dots between the things I’ve found and what they mean.

Sketch-1-600

You’ll need to be acting out a dialogue in your mind, between the content and the audience… converting this dialogue into a visual format. Think about the story you want to tell, where you want to place the accent and importance, and the quotes you want to use (speech or thought bubbles).

Rather than drawing all the ‘things’ I’ve just drawn text boxes or a description of what it should convey, like here it might be ’Patient in bed with ipad’ so my collaborators have an idea what I’m thinking.
Working at this basic level means it’s easy for people to contribute, add texture or meaning where it’s needed. (Like suggesting ‘patient wearing headphones’ etc.)

Add people and props.

This is the part where you literally put the people in the picture and think about the words and phrases you want to use.

Sketch-2-600

Your audience will be drawn to illustrations of people and the text immediately connected to these, so give thought to where you want this attention. At this stage I use a few stick or bubble figures with speech bubbles as placeholders to give myself, (and sometimes a client) a sense of how we could portray what’s going on in the moments / interactions in the patients’ world.

Make a list, and go shopping.

When I’m feeling happy with the arrangement and have an idea of which parts of the story should be supported by illustrations , it’s time to give the stick figures an upgrade.
I literally list out all the drawings I need and think about which ones I can draw, and which ones I’ll need help for.

ShoppingList-600
And when I say help, I mean Google Image Search. Here I typed in ‘Hospital bed’ to get an idea how these looked from a couple of angles. If you’re not so confident at drawing these things from screen, try printing them out and tracing them. Just hold them up to a window if it’s from a photo.

Keep it simple.

I try to avoid drawing busy scenes, so reduce illustrated elements to only where they will add value and support the narrative.
This means blob-headed androgynous people, sometimes without arms and other details. My experience is that it’s about what’s written in the speech bubble rather than whether your sketch of a person is wearing trainers or brogues. That’s why you didn’t realise the person pushing the tea trolley was male or female, let alone naked (!)

teatrolley-600
As you can imagine a finer level of detail can be handy at times, for example I could have had a stethoscope round the neck to identify a doctor in this image, but it wasn’t important enough to add it.

By the end of this you should have line drawings on paper ready to be scanned so you can put them into a digital document.

Drawings-in-ink-600

Get digital.

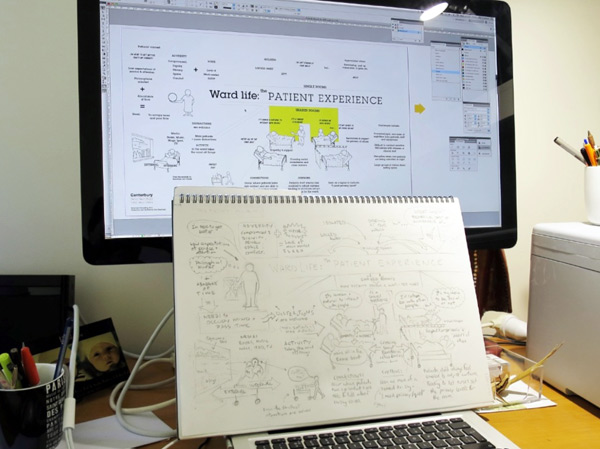
Open up a layout program that handles images and text. (I use Adobe Indesign) and set a massive document size. This one was about 1400mm wide x 900mm high. (You’re going to print this out BIG).
indesign-600

From here, use the ‘Text box’ tool to add in all your text as individual elements, then import your scanned drawings and go to work arranging these, being faithful to your paper mock-up.

Establish hierarchy.

Ok, it’s bit of a high-falooting word, but once I’ve got all the content loosely arranged I usually go about assigning a few type ‘styles’ so I can use sizing and bold etc. Creating this visual hierachy adds prominence and weight where it’s needed.

IndesignDetail-600

I’m usually thinking – “If someone’s only going to spend one minute looking at this, what do I want to be sure they’ll take in?”

… then assign extra weight to those elements. It’s not just a matter of making things bigger, sometimes giving more space around them can help with this.

Boxes and arrows.

It’s no coincidence that software toolkits have boxes, arrows, shapes and lines. This combo (and text of course) is all you really need, and doesn’t take long to get the hang of.

In this visual I’ve used boxes to say ‘these belong together’ some triangles for big arrow heads, and for the floor and walls I used the line tool where you just keep clicking corner points, then choose a colour for the ‘fill’.
closeup-600
After text and speech bubbles, (an oval and a triangle joined together) arrows are one of the hardest working tools in the box – particularly for non-linear artefacts like this one.  They help guide the viewer around, and show the links and sequence of things.
Indesign or even much less sophisticated programmes will have an easy toolbox and menu of line and arrow types, thin ones, fat ones… Mix it up!

Colouring in.

I keep things in black-white and greys as long as possible to make sure the message is getting across without colour, then go to Adobe Kuler to pick a palette of 3-5 colours, using some to add depth, and one or two for accents.

Printing.

Go BIG.
I recommend you call your local print shop, ask them how wide their roll is, and make this the shortest dimension of the printout.

Printing a UX research poster
A ‘wall sized’ visual (as opposed to individual A3 printouts) gets more eyeballs.

A poster provides a shared experience, get’s people out of their seat and generates the sort of response and conversation that matters to your project.

If you’ve read this far, you probably agree that ‘generating conversations that matter’ is a job text based reports all-too-often fail at.

So …pick up your pencil and start a conversation.